looney.eu
INFRASTRUCTURE / AUTOMATION / DEVELOPMENT
Fixing things that don't need fixing and breaking things that didn't need breaking.
I script workflows, deploy infrastructure, preach vim over nano, get unreasonably excited about open source tools and appreciate topping all that off with well-spent game time among friends.
Use keyboard to navigate → ↑ ↓ · press ~ for the prompt, try "help"
GET IN TOUCH
INFO

Infrastructure
Projects
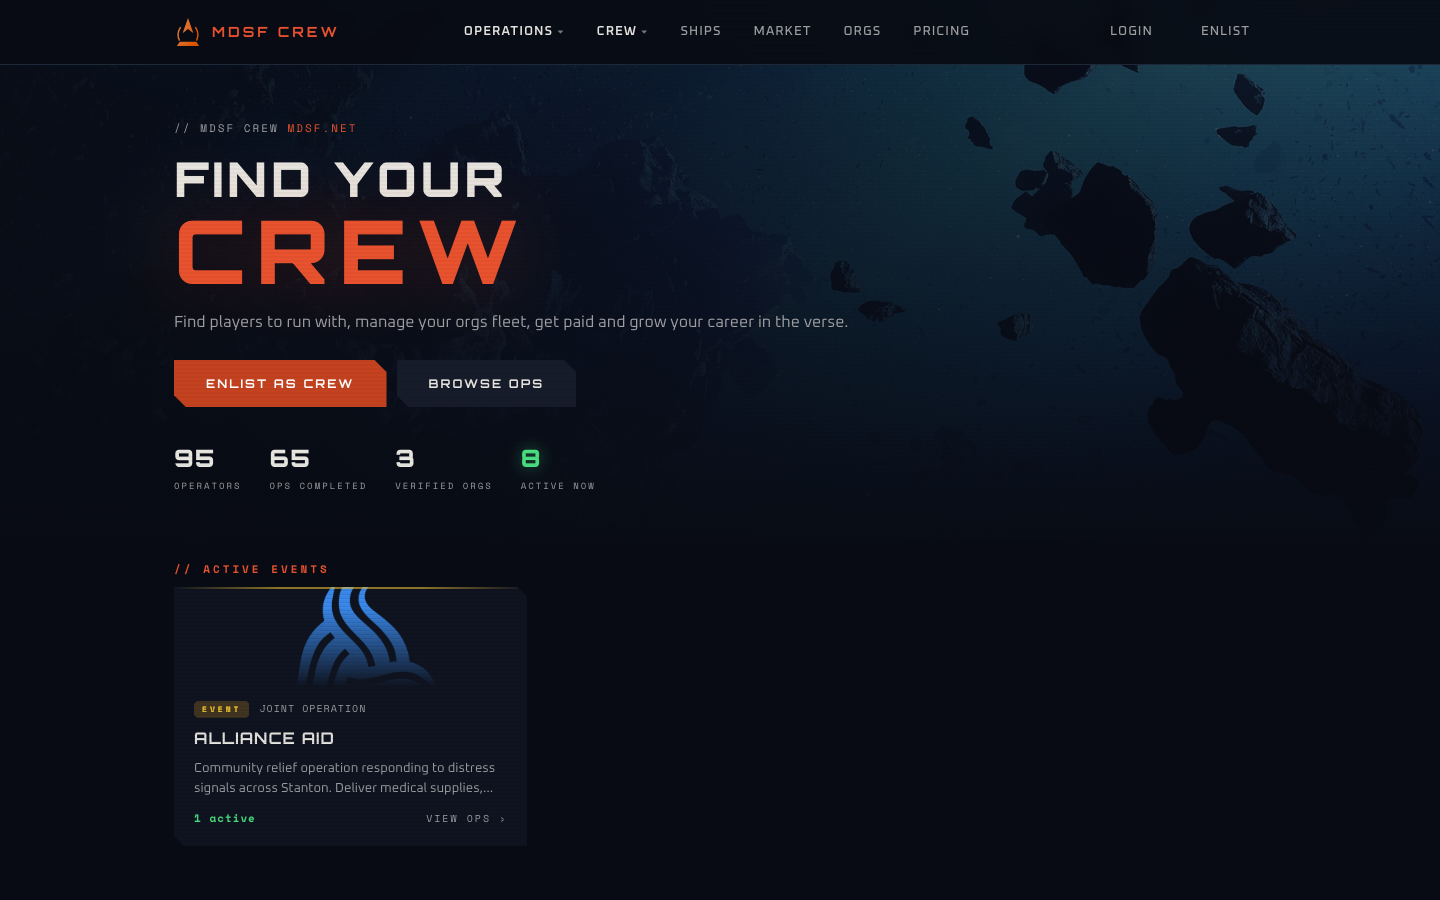
Crew-for-hire platform for Star Citizen. Recruiters post operations and assemble crews. Crew members list availability and build reputation through review-based rankings. Organisations manage squads, ranks, and fleets -- all tied to RSI-verified identities.
features
A foobar2000 component that renders animated GIF files as album art. Drop it in, point the artwork panel at a .gif, and your covers come alive — static art is so last decade.
C++ library that indexes a local music collection and resolves cover art by track metadata. Scans directories on startup, watches for changes, and returns matching cover art fast enough for real-time use in discord-music-presence.
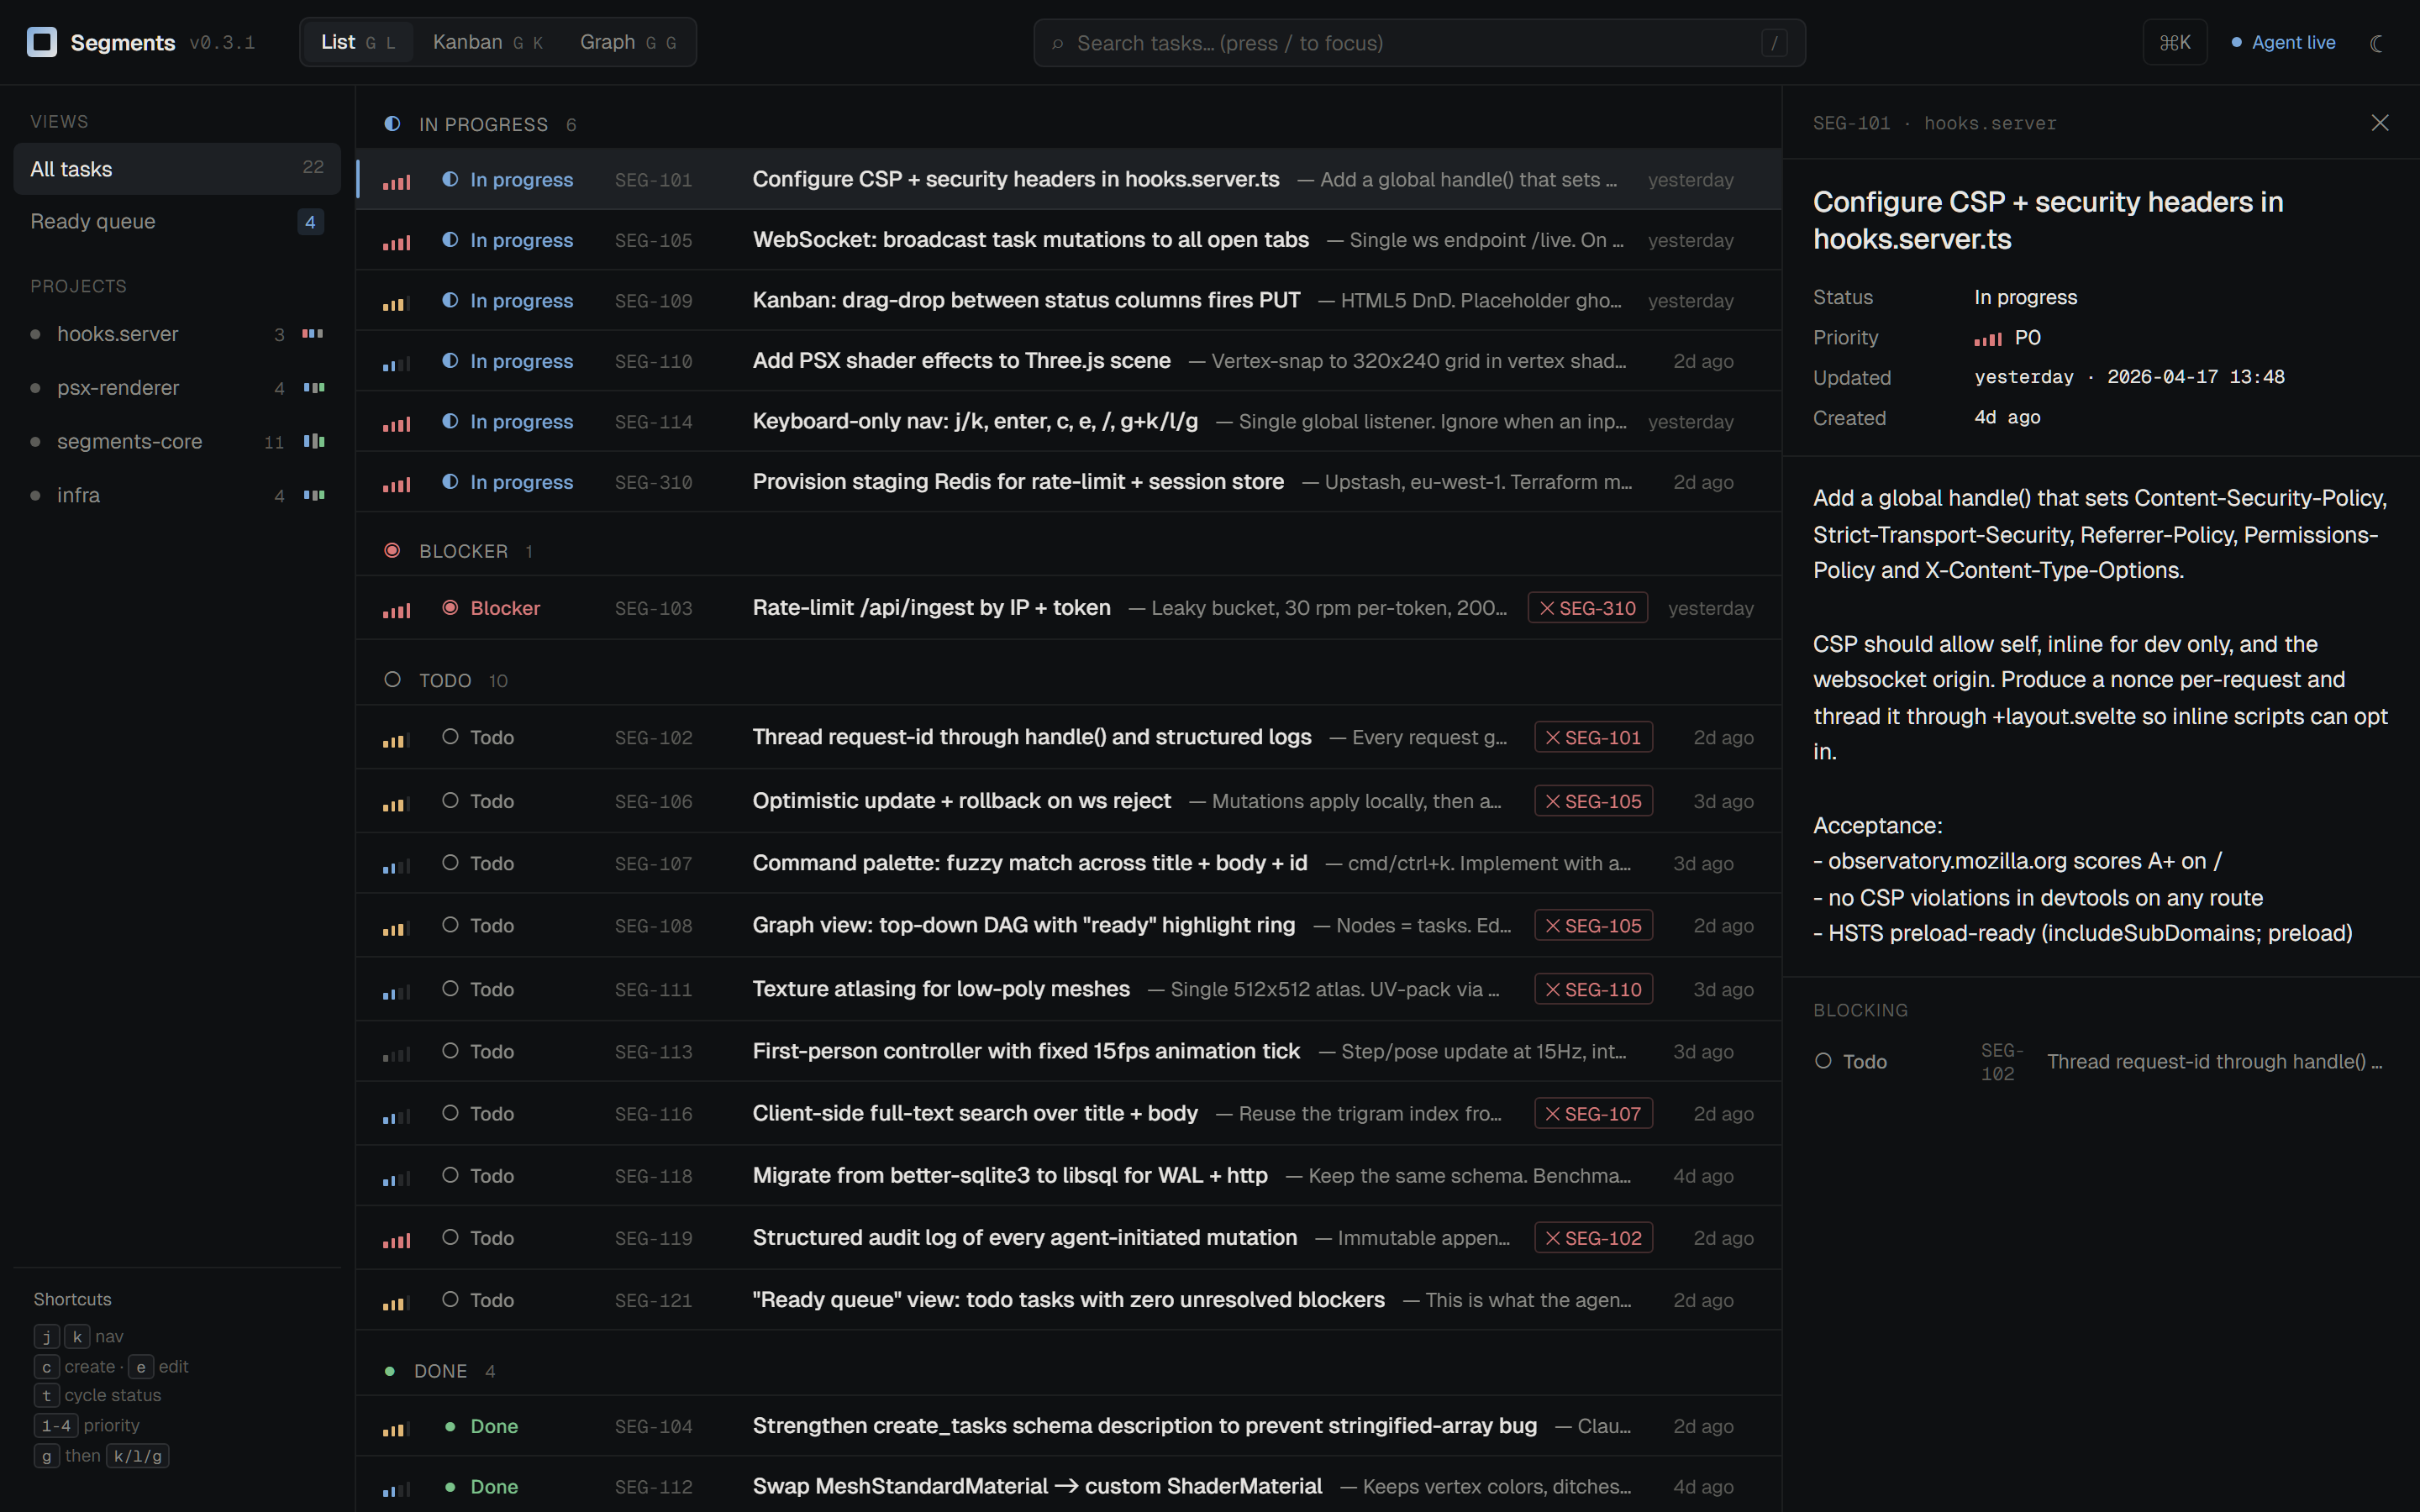
Single-binary task and project manager built as a faster replacement for Beads. It combines an LMDB-backed CLI, live web UI, and MCP tools for agent-friendly planning across projects.
CLI that answers "why is my shell doing this?" — inspects a shell session, applies per-shell startup-file rules, safely parses source statements, detects tooling hooks (starship, direnv, nvm, ...), and labels every file with a confidence level instead of pretending static analysis can prove runtime behavior.

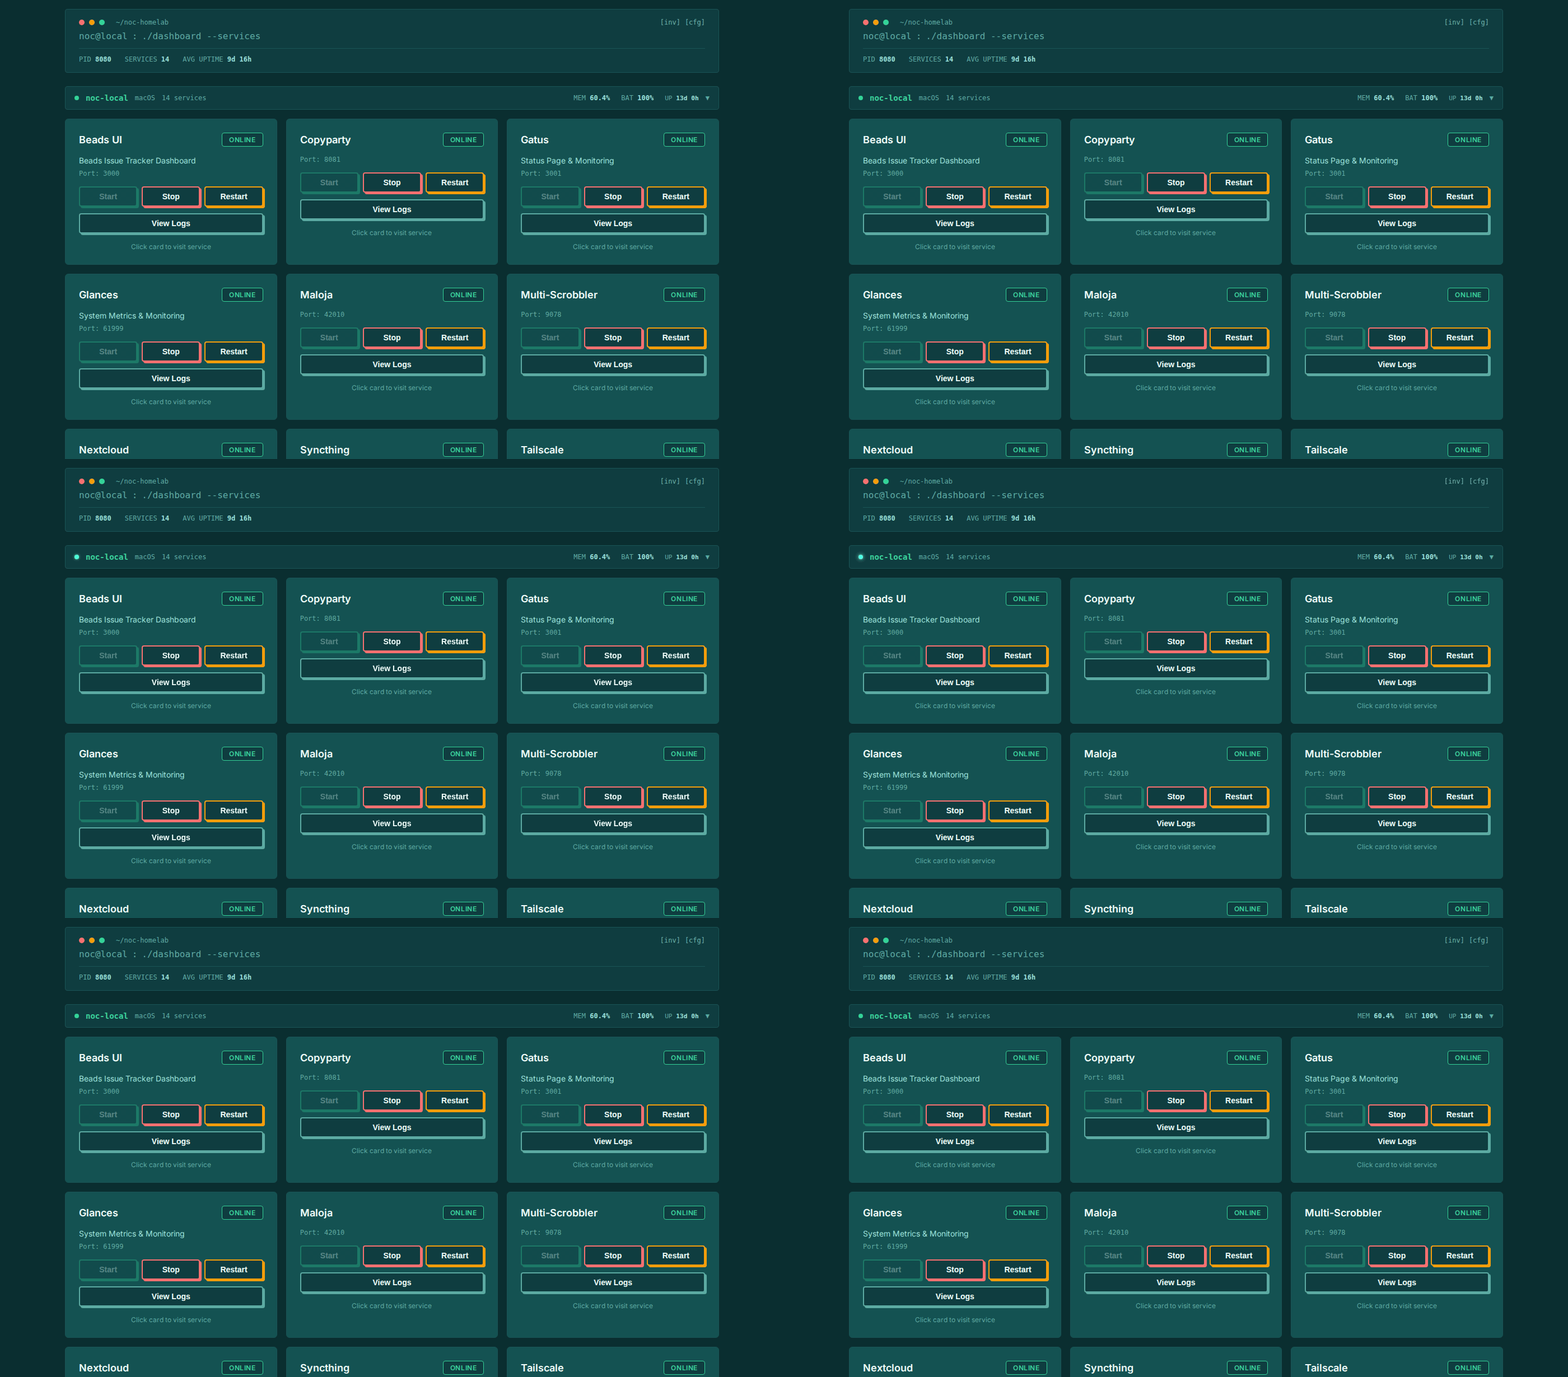
Four-machine homelab spanning macOS and Linux, connected over Tailscale. Runs media streaming, Matrix comms, game streaming, and monitoring through a central dashboard and agent API.
BLOG
↑↓ pick a post · ↵ read · inside a post: j/k scroll, n next, q back
What in the world is an Intune?
If you ever have the enjoyable opportunity to work with Intune, it’s honestly a nice bit of kit that can sometimes feel confusing and/or deranged to those learning it. It’s a cloud service provided by Microsoft that allows you to remotely configure devices (not just Windows, not just computers) with incredibly comprehensive policies & setup flows, if you ever thought that imaging systems is archaic, Intune has your answer, obviously if you’re happy to pay the price. You heard that right, if you want Intune, you will be paying for it, Microsoft knows how nice this software is and charge reasonably for it all things considered
You do not need to purchase Intune-specific licensing if you already have 365 Education A3, please research what licenses include intune access, I almost made this mistake, for full details, see the Microsoft wiki entry.
Key takeaways so far
ESP is great when you are licensed appropriately
If you plan on using app installation through ESP (Enrollment Status Page), ensure the account testing the flow is licensed for Intune.
An unlicensed account can cause ESP to stall during application identification or installation. Licensing is not the only possible cause, however. Broken detection rules, incorrect assignments, network issues and failed installers can produce similar behaviour.
Some apps are not as simple as pointing at the Windows Store
For many enterprise and endpoint applications, the recommended Intune deployment method will be documented by the vendor, commonly as an Intune Win32 app.
A Win32 app packages MSI, EXE, PowerShell and other traditional installers into an .intunewin file.
Intune then adds the useful Ansible-like behaviour around it: requirements, detection rules, retries, assignments and installation reporting.
The device showing as assigned but not showing in devices, what gives?
This one I didn’t even think was a problem, I just assumed it was slow to reflect in the dashboard, as one thing you learn about Intune is that at times, it can be slow and feel so very outdated for how sophisticated it is.
This wasn’t one of those times, this was me being naïve during my first deployment. Turns out, the MDM url for the Intune endpoint was set incorrectly on the Intune side, so when the device tried to call home, things were not perfectly working & thus didn’t register to devices.
Your first deployment goes wrong, what now?
If you mess up the flow, don’t stress, pending things are Entra joined and Intune enrolled, you can always recover via script or application policies after the fact, Intune makes life a lot easier for remediation post-deploy.
Autopilot registration is not Intune enrolment
A device appearing under Windows Autopilot devices only means Microsoft recognises its serial number and hardware hash and knows which deployment profile it should receive.
It does not mean the current Windows installation is enrolled in Intune. The device only becomes Microsoft Entra joined and Intune managed after it completes the Autopilot flow. This distinction matters when troubleshooting devices that show an assigned Autopilot profile but do not yet appear under managed Windows devices.
Likewise, deleting an Intune managed-device record is different from deleting the Autopilot registration. Removing the Autopilot registration removes the serial-bound deployment capability, while wiping or reinstalling Windows can leave that cloud registration intact for the next OOBE.
Scope your things.
ESP, policy, deploy groups, be verbose with creating profiles & scoping relevant flows to relevant categories, pending you document it well and identify what’s what, all this does is benefit the greater I.T services team & comply wit ITIL methods.
Block mission-critical apps behind ESP, not all apps.
I learned this the slightly more hard way, thought my ESP flow was broken when in fact I had just blocked the flow by putting the entire 365 suite as a required install. This meant instead of the user getting up & running with missions critical apps, they were waiting 15-20 minutes for the ESP flow to complete, which may make your users think something is broken.
Wrapping up.
So far, my time spent with Intune has been enjoyable, I think there’s a lot I still need to peel apart and dig under, but I’m excited to do so, I’ve learned a lot of hard lessons already, I’m sure it has many more to give.
Warmly, Adam.
WIKI
Documentation for each project, fed from Obsidian as markdown. Pick a page from the tree — or jump straight in:
From anywhere on the site: man segments in the prompt lands here.
The Machines section on this site’s home page is live homelab data. It comes from a static JSON file, /homelab-status.json, regenerated every 60 seconds — no backend behind the website, just a file push.
Pipeline
- The dashboard aggregates every machine’s agent reports into one status view.
- A LaunchAgent runs a push script each minute: it fetches that view, projects it through a public-services allowlist, folds in 24 hours of hourly history, and uploads the result to the webroots of both sites.
- The site fetches
/homelab-status.jsonclient-side and renders the machine chassis — no JS means no section, nothing else breaks.
The allowlist is the privacy boundary: only explicitly listed services appear publicly, under display labels chosen for the site. A consolidated entry can group several internal services under one light — it shows online only when all of them are.
Payload
{
  "updated": "2026-07-19T00:00:00Z",
  "machines": [
    {
      "id": "noc-tux", "label": "noc-tux",
      "online": true, "uptime": "…",
      "services": [ { "id": "matrix", "label": "Matrix", "online": true } ]
    }
  ]
}
Machine reachability, uptime, and per-service online flags — that’s the whole contract. History rides alongside for the 24-hour sparkline window.
A C++ library that indexes a local music collection and resolves cover art by track metadata. Written for discord-music-presence, where lookups need to be fast enough not to be noticeable: give it an artist / title / album query, get back the path to the matching cover art. If nothing matches, you get nothing back. That’s the whole thing.
How it works
Tags are read via TagLib — ID3 is the source of truth, not filenames or folder structure. The index lives in memory by default; set db_path to persist it via LMDB, which makes warm starts near-instant (the constructor returns in a few milliseconds and a background thread reconciles anything that changed while the app wasn’t running). A file watcher (efsw) keeps the index current while running.
Lookups use bigram similarity (Sørensen–Dice) so minor tag inconsistencies between what the OS reports and what’s in the file don’t cause misses. A composite score — title 50%, artist 35%, album 15% — is compared against a configurable threshold; set exact = true for strict matching instead.
Cover art resolves two ways: external files matched by case-insensitive regex (default cover\.gif), or embedded pictures read from the audio tags when embedded is on.
Performance
Benchmarked on a 4,470-track library (Windows 11, SSD), external-art mode:
Supported formats: mp3, flac, ogg, opus, m4a, aac, wav, aiff, wv, ape, mpc, wma — anything TagLib can read tags from.
Integration details live in the API page.
A foobar2000 component that renders animated GIF files as album art. Drop it in, point the artwork panel at a .gif, and your covers come alive — with transparency, smooth scaling, and graceful fallbacks when there’s no GIF to be found.
Features
- Animated GIF playback in the Album Art Viewer
- Static images too: JPG, PNG, WEBP, BMP
- Embedded album art fallback when no external file matches
- Transparency and smooth scaling
Install & use
Grab the pre-built .fb2k-component from the releases page and drag it into foobar2000 (or copy the .dll into components/), then add Album Art Viewer to your layout from UI elements.
Name your art files so the component finds them, next to the music:
Requires foobar2000 2.1+ (x64) on Windows 10 or newer.
Building
C++ against the foobar2000 SDK (2025-03-07+) with WTL 10, built with Visual Studio 2022 / MSBuild — the README walks through the SDK layout and the wtl.props path setup. MIT-licensed.
Each machine runs a small Flask agent exposing a uniform HTTP API over Tailscale. The dashboard is just a client of these agents — every machine answers the same questions the same way, whether the service behind it is a systemd unit, a LaunchAgent, or a Docker container.
Endpoints
Unknown services 404; unknown actions 400. The logs action takes an optional line count and returns the service’s recent output.
Service registry
Each agent reads a config.yaml describing its host’s services: an id, a label, and how the service is managed. Platform handlers translate the uniform API onto the native service manager — systemctl on Linux, launchctl on macOS, the Docker API for containers. Adding a service to a machine is one YAML entry; the dashboard picks it up on the next poll.
The public status feed described in status API is an allowlisted projection of what these agents report.
One header, one config struct, one lookup call.
#include <gindexer/gindexer.h>

gindexer::config cfg;
cfg.dirs = {"/home/user/music"};
cfg.splitter = split;            // your artist-splitting logic

gindexer::indexer idx(std::move(cfg));

auto result = idx.lookup("Radiohead", "Creep", "Pablo Honey");
if (result) {
    // result->cover    — path to the cover art (or the audio file itself
    //                    when the art is embedded; check result->embedded)
    // result->artist / title / album — the matched track's tags
}
A miss means the track isn’t in the index — the watcher keeps things current, so “not indexed yet” isn’t a state you see.
Config
External cover art must sit in the same directory as the audio file it belongs to.
Building
CMake 3.27+ and a C++17 compiler. Dependencies — TagLib, efsw, LMDB, lmdbxx, Catch2 — are fetched automatically via FetchContent:
cmake -B build
cmake --build build
ctest --test-dir build --output-on-failure   # with -DBUILD_TESTING=ON
Static analysis cannot prove runtime shell behavior, and shellwhy refuses to pretend otherwise. Every startup file in a report carries one of six labels:
Static mode
The default. It identifies the target shell from --shell, $SHELL, or parent-process metadata; infers login / interactive / SSH / terminal context from flags, argv, TTY state, and environment; applies the startup rules for that shell and mode; checks which files exist; and shows files skipped by precedence — bash reading only the first existing ~/.bash_profile, ~/.bash_login, or ~/.profile is the classic case. Simple source statements are parsed without evaluating shell code.
What it cannot do: prove conditional branches, dynamic paths, plugin-manager side effects, aliases, functions, exports, or PATH changes created at runtime. Those stay possible at best.
Trace mode
shellwhy trace launches a fresh target shell and observes file access through a platform backend — currently strace on Linux, with dtruss/fs_usage planned for macOS. Observed files are merged into the report as confirmed. The trade-off: trace mode runs the user’s startup code, because it starts a real shell. Use static mode when analysis must be non-invasive.
A four-machine homelab running macOS, Linux, and a VPS, connected over Tailscale. It manages media streaming, Matrix communications, game streaming, and monitoring through a central dashboard and a per-machine agent API. The repo is the infrastructure and its documentation: service configs, systemd units and LaunchAgents, deployment scripts, and operational notes.
Machines
How it hangs together
The dashboard on noc-local polls each machine’s agent API for live service status; service control (start / stop / restart) is forwarded through the agents, which manage systemd units, LaunchAgents, and Docker containers.
File sync is hub-and-spoke: noc-local holds the only writable git clone, and Syncthing distributes the working tree to the other machines. Edits made on a spoke propagate back to the hub for commit — so the whole fleet’s config is one reviewed git history.
A public slice of the monitoring feeds this very site: the Machines section on the home page renders the status JSON the homelab publishes.
Elsewhere
Mirrored to GitHub from a self-hosted Forgejo. Secrets are git-crypt-encrypted in the repo; the plaintext never leaves the machines.
shellwhy answers a practical dotfiles question: “why is my shell doing this?” It inspects the current or requested shell mode, applies startup-file rules, safely parses obvious source statements, detects common shell tooling hooks, and reports what is inferred, possible, missing, skipped, or observed. Written in Rust; MIT/Apache-2.0 dual-licensed.
There was no standardised way to check how a shell is configured and which files are affecting the running process — this is that tool.
Features
- Static startup-file rules for
bash,zsh, andfish, with conservative fallbacks forsh/dash,ksh/mksh,tcsh/csh, andnu - Safe static parsing for obvious
source fileand. filestatements — no shell code is executed - Detection for common tooling hooks:
starship,oh-my-zsh,zinit,direnv,asdf,pyenv,nvm,fnm,fisher,tide - Human-readable, plain, and JSON output
- Linux trace mode using
straceto observe what actually loads
Usage
shellwhy                                   # infer and explain the current shell
shellwhy --shell bash                      # explain bash startup for this user
shellwhy --shell zsh --login --interactive # a specific mode
shellwhy --shell bash --json               # machine-readable
shellwhy trace --shell fish                # observe via strace (Linux)
shellwhy explain                           # why shell-startup certainty is hard
Install
cargo install --path . # from a checkout
Every reported file carries a confidence label rather than a pretence of certainty — the confidence model is the core design idea.
Segments ships as a single binary named sg. The install scripts download a pre-built binary for your platform and fall back to building from source when none is available.
macOS / Linux
curl -fsSL https://git.nocfa.net/NocFA/segments/raw/branch/main/scripts/install.sh | bash
Windows
powershell -ExecutionPolicy Bypass -Command "irm https://git.nocfa.net/NocFA/segments/raw/branch/main/scripts/install.ps1 | iex"
Installs to %USERPROFILE%\.local\bin and adds it to the user PATH. If a source build is needed, the script auto-installs Go and MinGW-w64 via winget.
From source
git clone https://git.nocfa.net/NocFA/segments.git
cd segments
make install
Quick start
sg setup    # configure integrations (Pi, Claude Code, OpenCode)
sg start    # start the server
Then open http://localhost:8765 for the web UI, and sg init inside a project directory to start tracking it. sg setup is the required first step — it wires the MCP server and editor integrations.
Segments speaks MCP so coding agents can plan against the same task state you see in the CLI and web UI. sg setup wires the integrations: Claude Code, OpenCode, and a Pi extension embedded in the binary for task-aware AI sessions.
Scoping
Every tool call auto-resolves the current project from the agent’s working directory — an MCP call from inside a repo is about that repo’s tasks unless the agent explicitly asks otherwise (all_projects=true, or --all on the CLI). Task IDs are globally addressable: a full UUID or unique prefix resolves across all projects.
Tools
Session integration
A SessionStart hook prints an orientation banner — in-progress claims, recently closed tasks — so an agent starts each session knowing the state of play. Agents claim work by setting a task in-progress, which every other session and the web UI see live. A stdio shim lets multiple MCP clients share one server instance.
Changes made by agents surface in the web UI over WebSocket as they happen, which makes it easy to watch an agent burn through a queue.
The full command surface of sg. Aliases are shown in parentheses.
Server
Tasks
Setup
Maintenance
Info
How these compose day to day is covered in workflow.
sg start serves a live dashboard at http://localhost:8765. Pick a theme from the dropdown in the top bar — each supports light and dark modes.
Views
Real-time
Every tab connects over WebSocket and receives live deltas for task and project changes, whether those come from another tab, the CLI, or an MCP agent. New tasks slide in; edits pulse briefly.
Keyboard
Ctrl+K / Cmd+K opens a command palette that fuzzy-jumps between projects, views, and tasks. Beyond that:
An aggregated All tasks scope spans every project, plus a ready-queue filter for tasks with no outstanding blockers.
A performant, lightweight, single-binary task and project manager, written in Go. Built as a faster, leaner alternative to Beads: same job, LMDB under the hood, no Dolt, no fuss. One binary carries the CLI, a live web UI, and an MCP server for AI coding agents.
Synopsis
sg <command> [flags]
Why
Beads is slow, heavy, and leans on a Dolt DB infrastructure that is miserable to live with. Segments keeps the idea — projects, tasks, priorities, dependency chains — and drops the weight. It is especially nice for solo power users, but nothing stops you from reverse-proxying the dashboard for a team, or orchestrating downstream actions off its state.
Surfaces
Features
- Projects and tasks with priorities, statuses, dependency chains, and rich-text bodies
- Three interchangeable web themes (Obsidian, Console, Dossier), each with light and dark modes
- Three views: grouped List, drag-and-drop Kanban, and a top-down dependency Graph
- Real-time updates over WebSocket — edits from another tab, the CLI, or an MCP agent show up live
- Command palette and full keyboard-first navigation
sg nextto pick the best unblocked task,sg statsfor a progress dashboard,sg exportfor JSONL snapshots- Beads import for migrating an existing backlog
Status
Work in progress, but stable enough for daily use. Release series so far: 0.1 foundation (LMDB storage, core CLI, first MCP integrations, basic web UI), 0.2 TUI ergonomics and Windows support, 0.3 the three-theme GUI with Graph/Kanban/List views, 0.4 (current) MCP and session polish — globally addressable task IDs, SessionStart hooks, a stdio shim for multi-client MCP. 0.5 targets optimisation, 0.6 GUI polish.
Start with install.
The daily loop Segments is built around: capture everything, then always know what to pick up next.
sg init          # once, in the project directory
sg add           # capture work as it appears
sg next          # what should I do now?
sg done <id>     # ship it
The ready queue
A task is ready when it is a todo with no outstanding blockers. sg next ranks the ready queue — highest priority first, oldest wins ties — and prints the best pick followed by the rest. Dependency chains (task B blocked by task A) keep downstream work out of the queue until its blockers land.
Priorities
Projects
sg list scopes to the project matching the working-directory name, so a plain sg list inside a repo shows that repo’s tasks. The web UI’s All tasks scope aggregates across every project when you want the portfolio view.
Snapshots and migration
sg export streams task state as JSONL — one event per line — suitable for git-tracked snapshots or downstream pipelines. Configure a path in config.yaml to have every CLI / MCP mutation append automatically. Coming from Beads, sg beads imports an existing backlog wholesale.